
Boost Profitability with Interactive Finance Dashboards Tools
Financial management, clarity is currency. Finance dashboards have emerged as indispensable companions for professionals aiming to translate complex data into actionable strategies. By harnessing the power of visual analytics, these dashboards illuminate trends, reveal potential risks, and drive smarter decisions in real time.
Why Finance Dashboards Are Essential for Every Organization
Finance dashboards are more than digital spreadsheets. They are intuitive platforms that bring together diverse financial data, offering a panoramic view of an organization’s fiscal health. Whether monitoring cash flow, forecasting revenues, or tracking expenses, these dashboards ensure transparency and foster accountability.
Types of Finance Dashboards: Customizing for Every Need
Not all financial analytics are created equal. Different organizations require tailored solutions, and Finance Dashboards rise to meet each demand. Explore these distinctive types:
-
Operational Dashboards: Real-time tracking of daily transactions and expenditures.
-
Analytical Dashboards: Deep dives into historic trends for forecasting and planning.
-
Strategic Dashboards: Big-picture overviews for executives and stakeholders.
-
Tactical Dashboards: Focused on short-term milestones and budget adherence.
-
Personal Dashboards: Tailored for individuals to monitor personal finance goals.
Key Advantages of Modern Finance Dashboards
What makes Finance Dashboards stand out in today’s digital landscape?
-
Instant Data Visualization: Transform raw figures into clear, interactive visuals.
-
Automated Reporting: Save time with scheduled updates and automatic calculations.
-
Centralized Information: Aggregate data from multiple sources for a unified view.
-
Custom KPI Tracking: Monitor unique business objectives effortlessly.
-
Enhanced Collaboration: Facilitate seamless sharing among teams and stakeholders.
Building a Finance Excel Dashboard: Simple Steps for Impact
Crafting a finance Excel dashboard is about more than inputting figures. Begin by defining the financial KPIs crucial to your business. Gather clean data, outline the dashboard’s structure, and leverage Excel’s capabilities for charts, slicers, and conditional formatting. Ensure your dashboard remains intuitive, concise, and visually engaging.
Power BI Financial Dashboard: Elevating Analytics
For organizations seeking advanced analytics, a Power BI financial dashboard delivers unparalleled interactivity and depth. Integrate live data, deploy drill-down features, and build custom visuals to unlock new levels of financial intelligence.
Best Practices for Financial Reporting Dashboard Success
A financial reporting dashboard should not overwhelm users. Focus on clarity, relevance, and actionable insights. Keep visuals minimalistic, use color to highlight trends, and ensure real-time updates for accurate reporting.
Financial Dashboard Software: The Digital Backbone
Selecting the right financial dashboard software is pivotal. Look for platforms that offer flexibility, scalability, and robust security. Integration with existing accounting systems and the ability to customize KPIs are essential features for lasting value.
Tableau Financial Dashboards: Visual Storytelling for Finance
Harnessing the potential of Tableau financial dashboards brings a new dimension to data presentation. Employ interactive charts, heatmaps, and timelines to narrate the story behind your numbers, making financial reports not just informative but engaging.
Finance Dashboards for Personal Use: Empowering Individuals
A personal financial dashboard Excel template empowers individuals to monitor spending, savings, and investments. Simple visual cues and automatic calculations make personal finance management accessible to everyone.
Financial KPI Dashboard: Measuring What Matters
A well-constructed financial KPI dashboard provides targeted insights into profitability, liquidity, and efficiency. By focusing on these core metrics, organizations can swiftly identify strengths and address vulnerabilities.
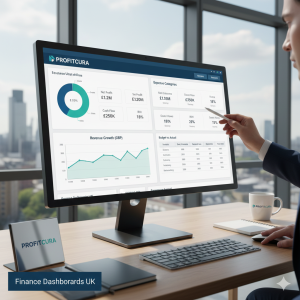
Sample Financial Dashboard: A Glimpse into Modern Reporting
Reviewing a sample financial dashboard offers inspiration for design and functionality. Notice how critical metrics are presented, how drill-downs are enabled, and how color guides the viewer’s attention.
Five Unique Benefits of Finance Dashboards
-
Real-Time Clarity: Access up-to-date financial information instantly.
-
Customizable Views: Tailor dashboards to specific user roles and goals.
-
Risk Detection: Spot anomalies and emerging threats at a glance.
-
Performance Monitoring: Track financial health with actionable metrics.
-
Effortless Collaboration: Share dashboards securely with teams and partners.
Adopting finance dashboards signals a move toward financial empowerment and agility. Whether utilizing a Power BI financial dashboard, designing a personal financial dashboard in Excel, or exploring the advantages of financial dashboard software, the right tools can transform raw data into a roadmap for success. Organizations embracing these innovations set themselves apart, cultivating a culture of transparency, efficiency, and informed action.
FAQs
1. How does a Power BI financial dashboard support complex reporting needs?
A Power BI financial dashboard delivers interactive visuals and real-time analytics, making financial data easier to interpret and share.
2. What makes a finance Excel dashboard effective for daily tracking?
A finance Excel dashboard centralizes transactions, expenses, and key metrics in a single, easy-to-use interface for everyday monitoring.
3. Why is Power BI financial reporting valuable for organizations?
Power BI financial reporting automates updates and provides deeper insights, helping organizations make faster, data-driven decisions.
4. Where can I find financial dashboard examples for inspiration?
Financial dashboard examples showcase different layouts and metrics, guiding users to design dashboards that fit specific reporting needs.
5. What is a sample financial dashboard used for in business?
A sample financial dashboard acts as a template, illustrating how to present financial KPIs, trends, and forecasts visually.
6. How does financial dashboard software enhance analysis?
Financial dashboard software streamlines data integration, offering customizable features and automated visualizations for efficient analysis.
7. What are the advantages of Tableau financial dashboards?
Tableau financial dashboards provide advanced interactivity and flexible design, enabling users to explore and communicate financial trends clearly.